
Service Monitor
Know when something stops, before someone tells you.
A free, open-source monitor for websites, ports, hosts, services, containers, CPU, memory and disk. One Java program, the hub, keeps the results, shows them in a web dashboard and sends the alerts. A small agent on each server runs the checks there and only ever connects out to the hub, so monitored servers open no ports.
It watches this site and the apps on it.
Version 0.1.0 · Apache-2.0 · hub anywhere with Java 21 · agent built for Windows, Linux, macOS and FreeBSD
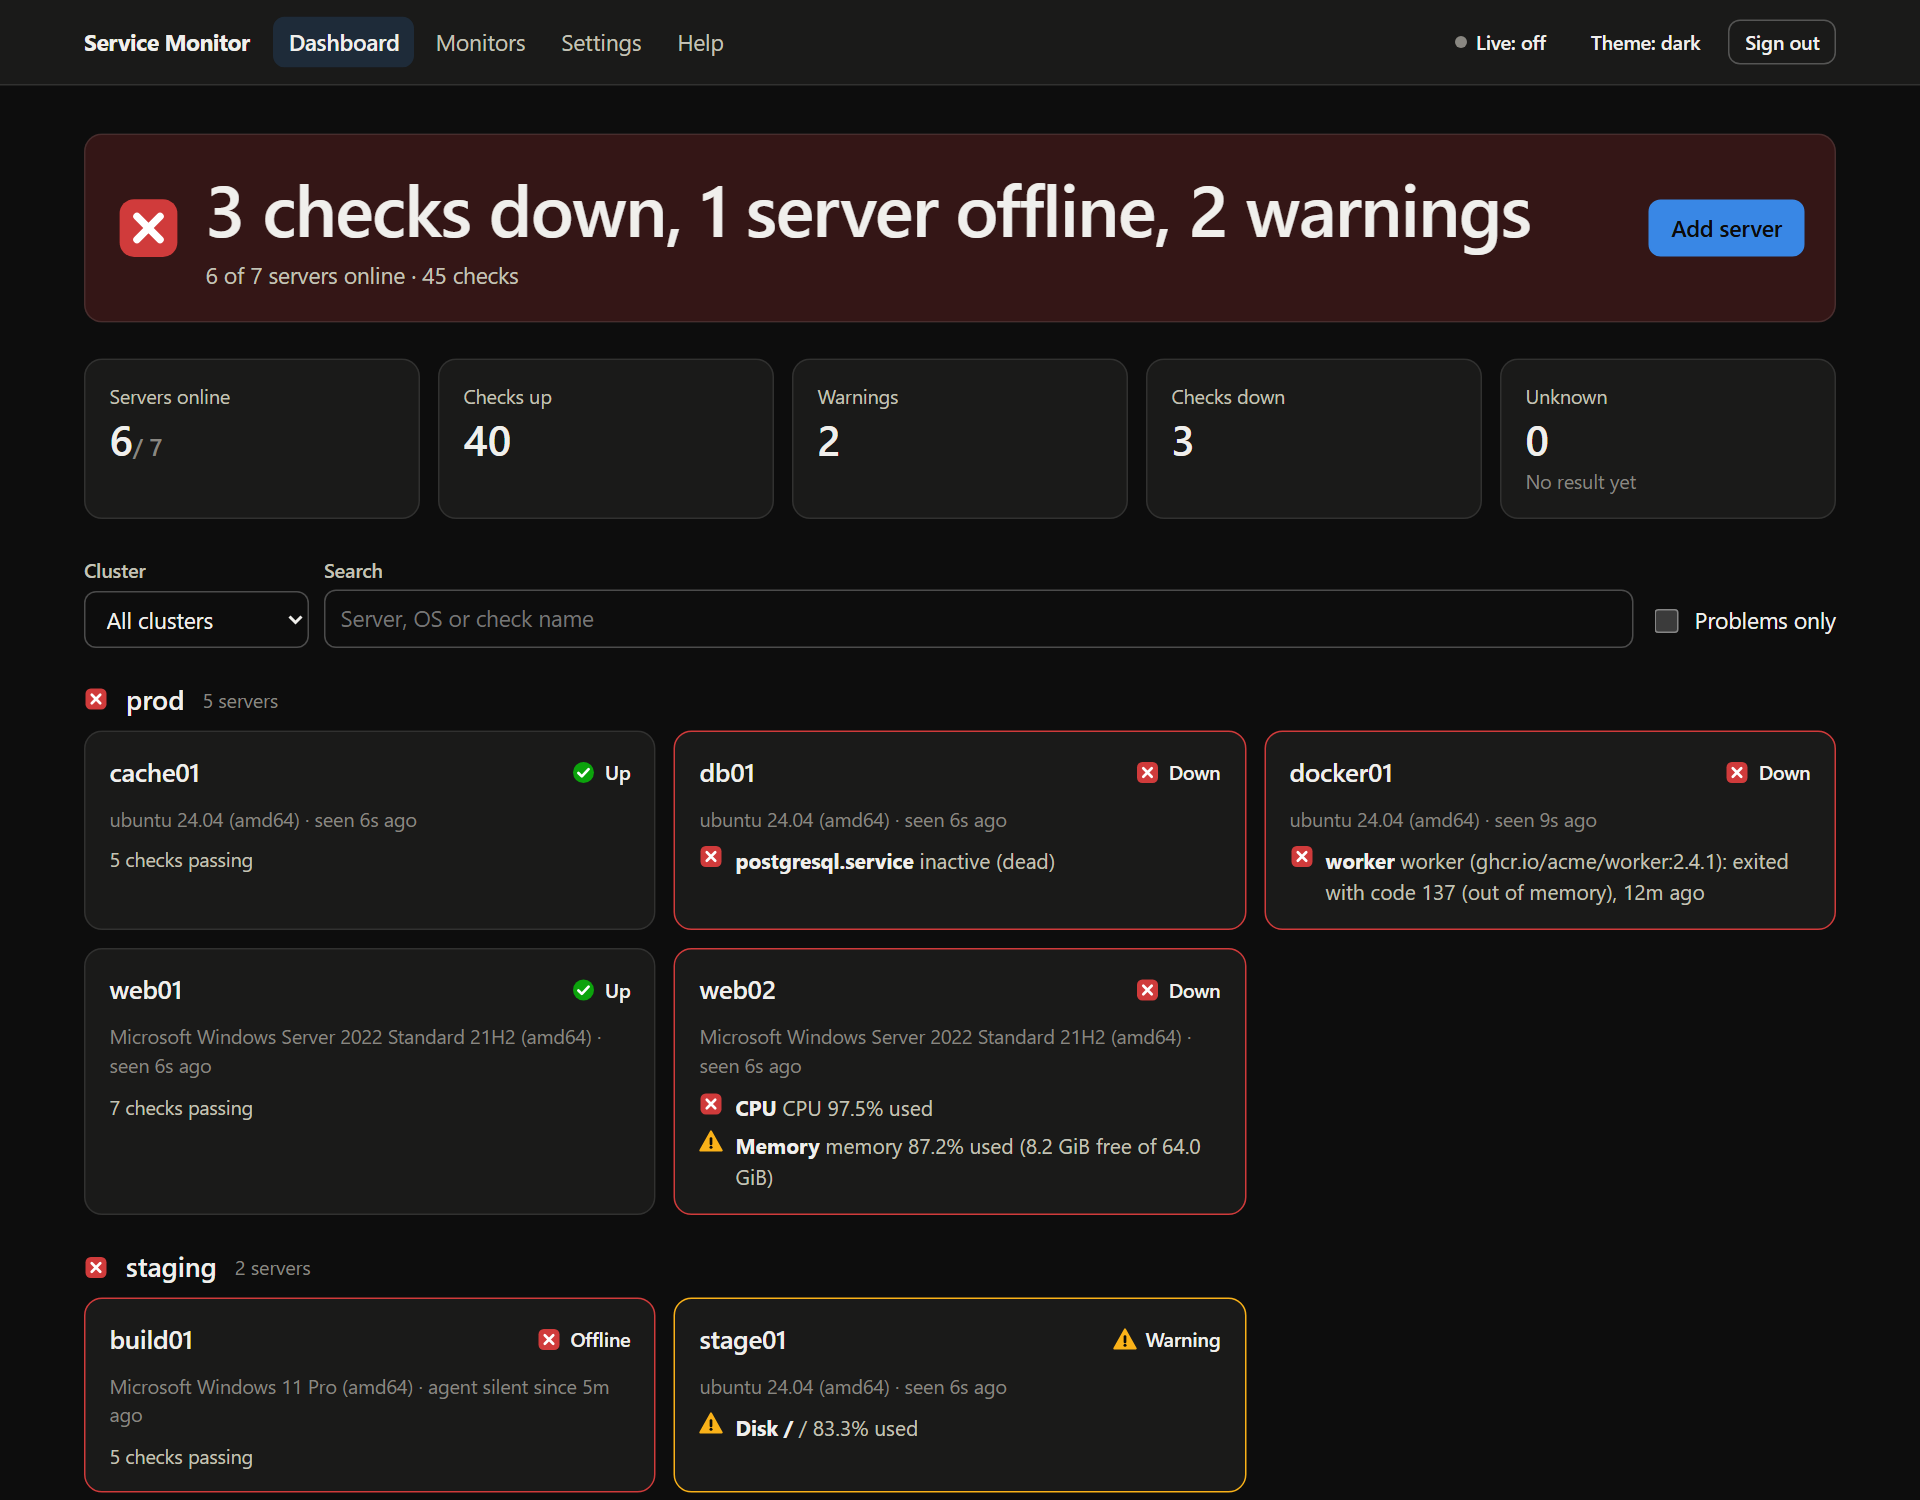
What it watches
Websites
An address answers with the right status and, if you like, a word on the page. HTTPS checks warn before the certificate expires.
Ports and hosts
A TCP port that opens, such as a database, and a host that answers a ping, from the hub or from a server's own side of the network.
Services
A Windows service, a systemd unit or a launchd job is running. The agent lists what exists; nothing is watched until someone adds it.
Containers
A Docker or Podman container is running and healthy. The agent only reads from the runtime, never changes it.
CPU, memory and disk
Percent used, with a warning and a down level you choose, drawn over time against those lines.
Alerts
When a check goes down, warns or comes back: email (with a link back to the dashboard), Slack, Discord or any webhook.
How it fits together
The hub
One Java jar with the REST API, the dashboard inside and a SQLite database. It runs as a Windows service or a systemd unit, or anywhere with Java 21.
The agent and the command line
One small Go program, svcmon. On a server it is the agent; anywhere else
the same program is a command line for the hub, for scripts and terminals.
Checks where you work
Add checks in the dashboard, or on the server itself with
svcmon agent check add, without signing in to the hub.
People and safety
People sign in with their own account, as administrator or read-only. By default the hub is used only from inside your network. An activity log shows who did what, and passwords and tokens are stored only as hashes.
A closer look
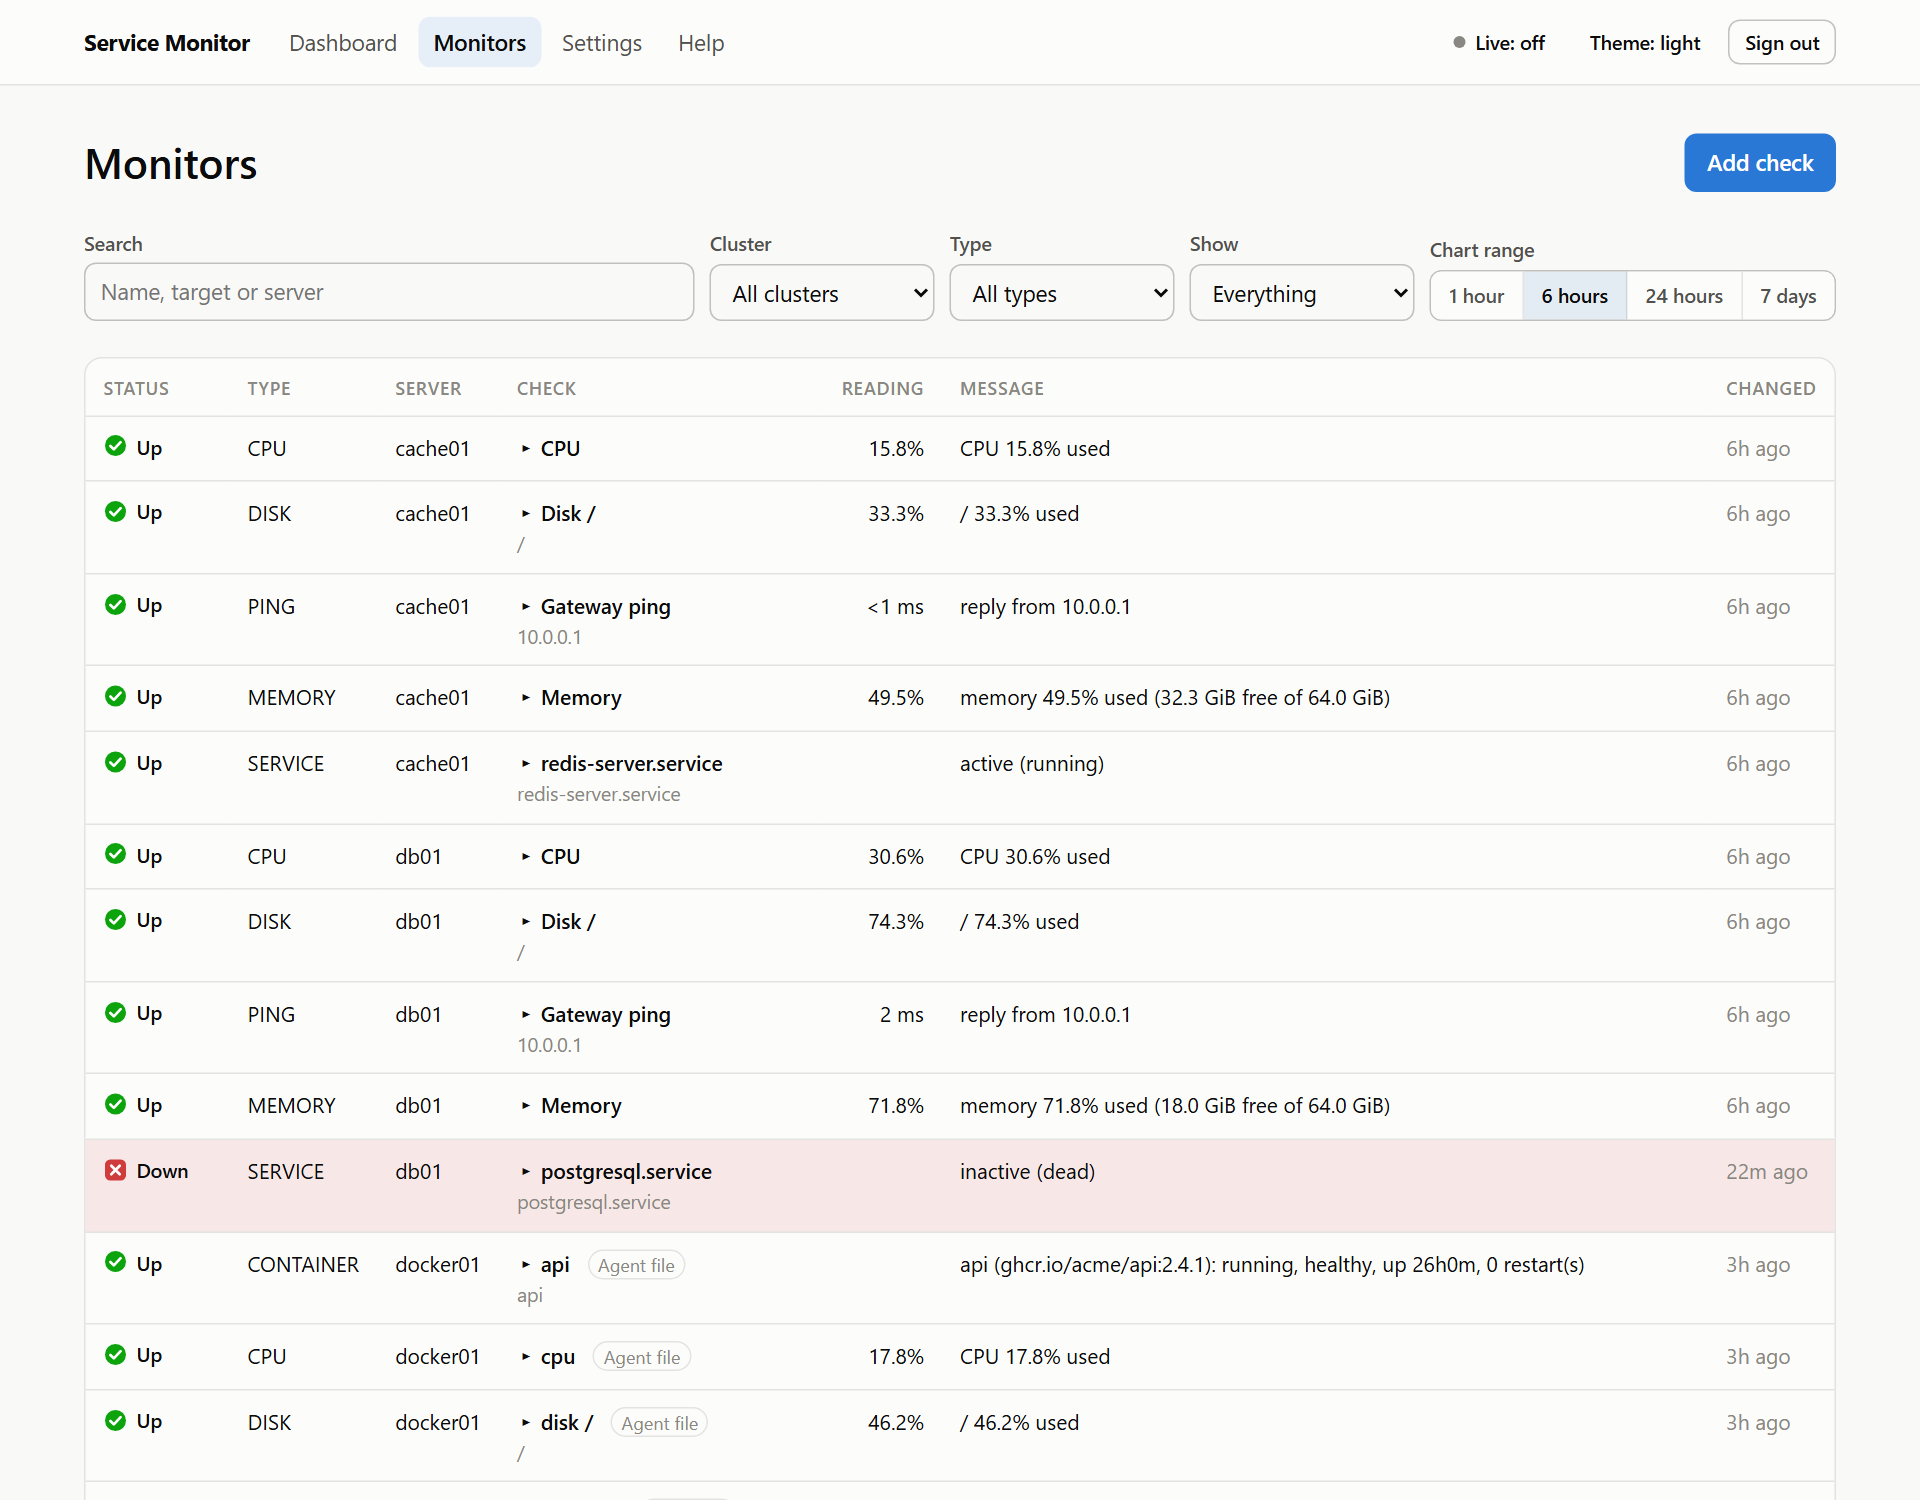
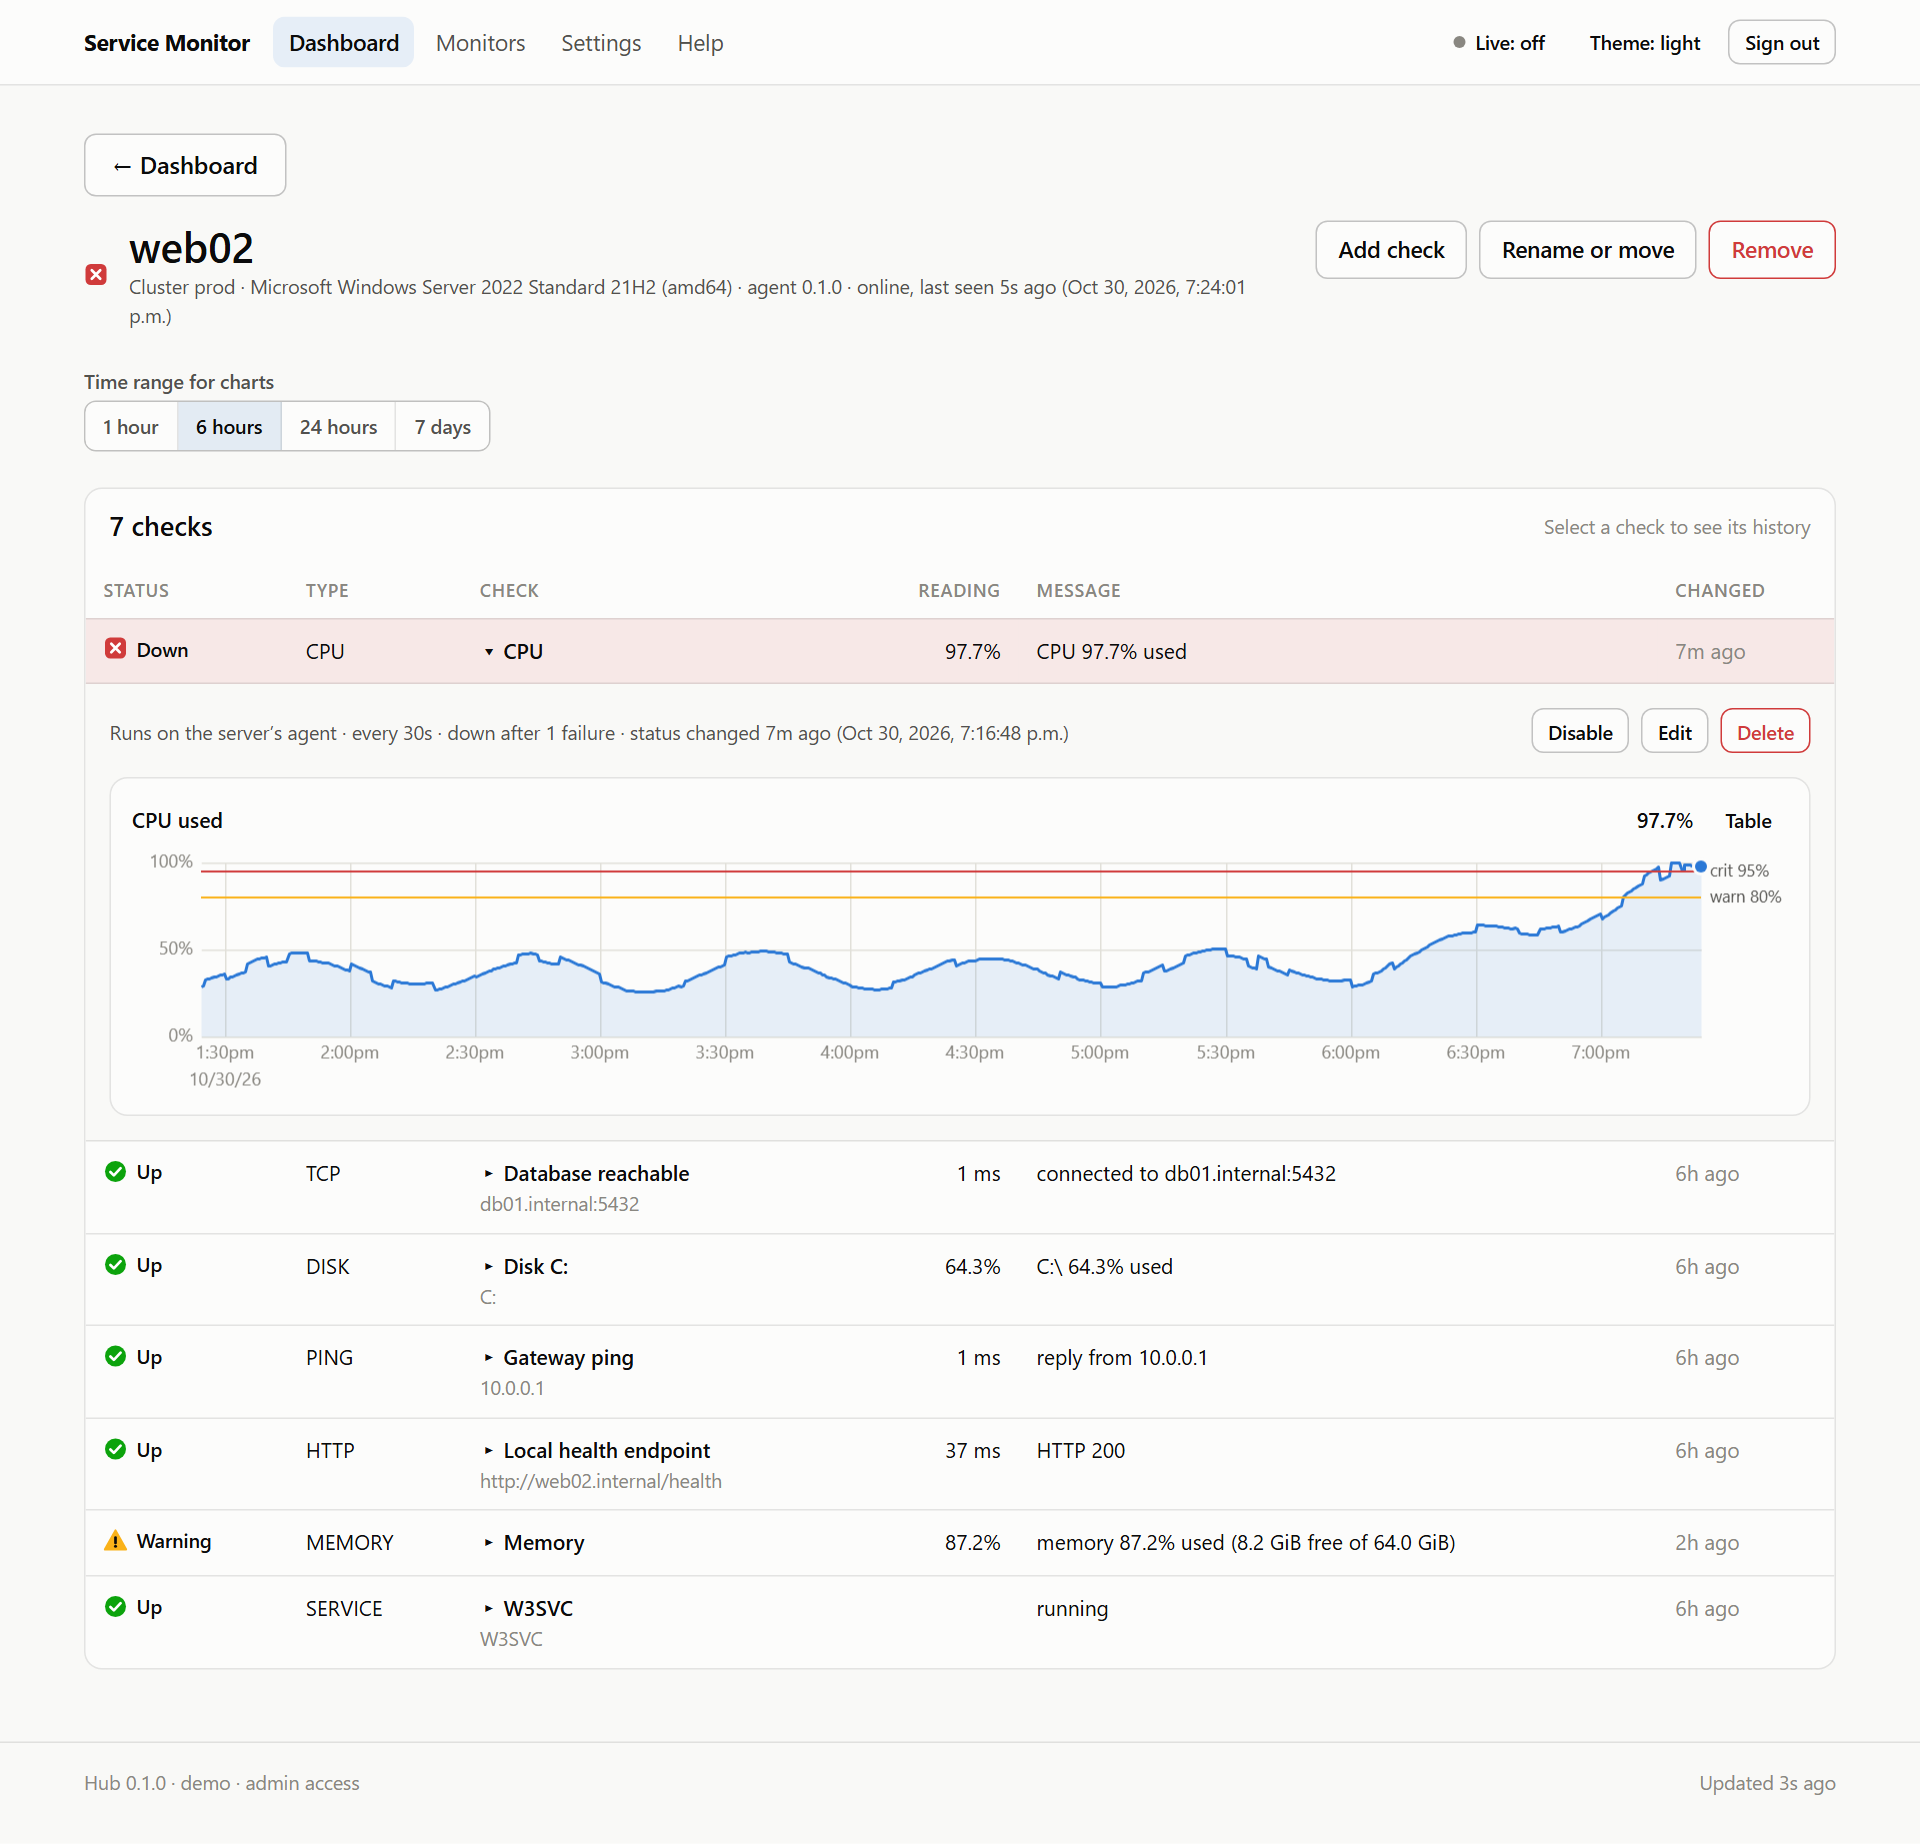
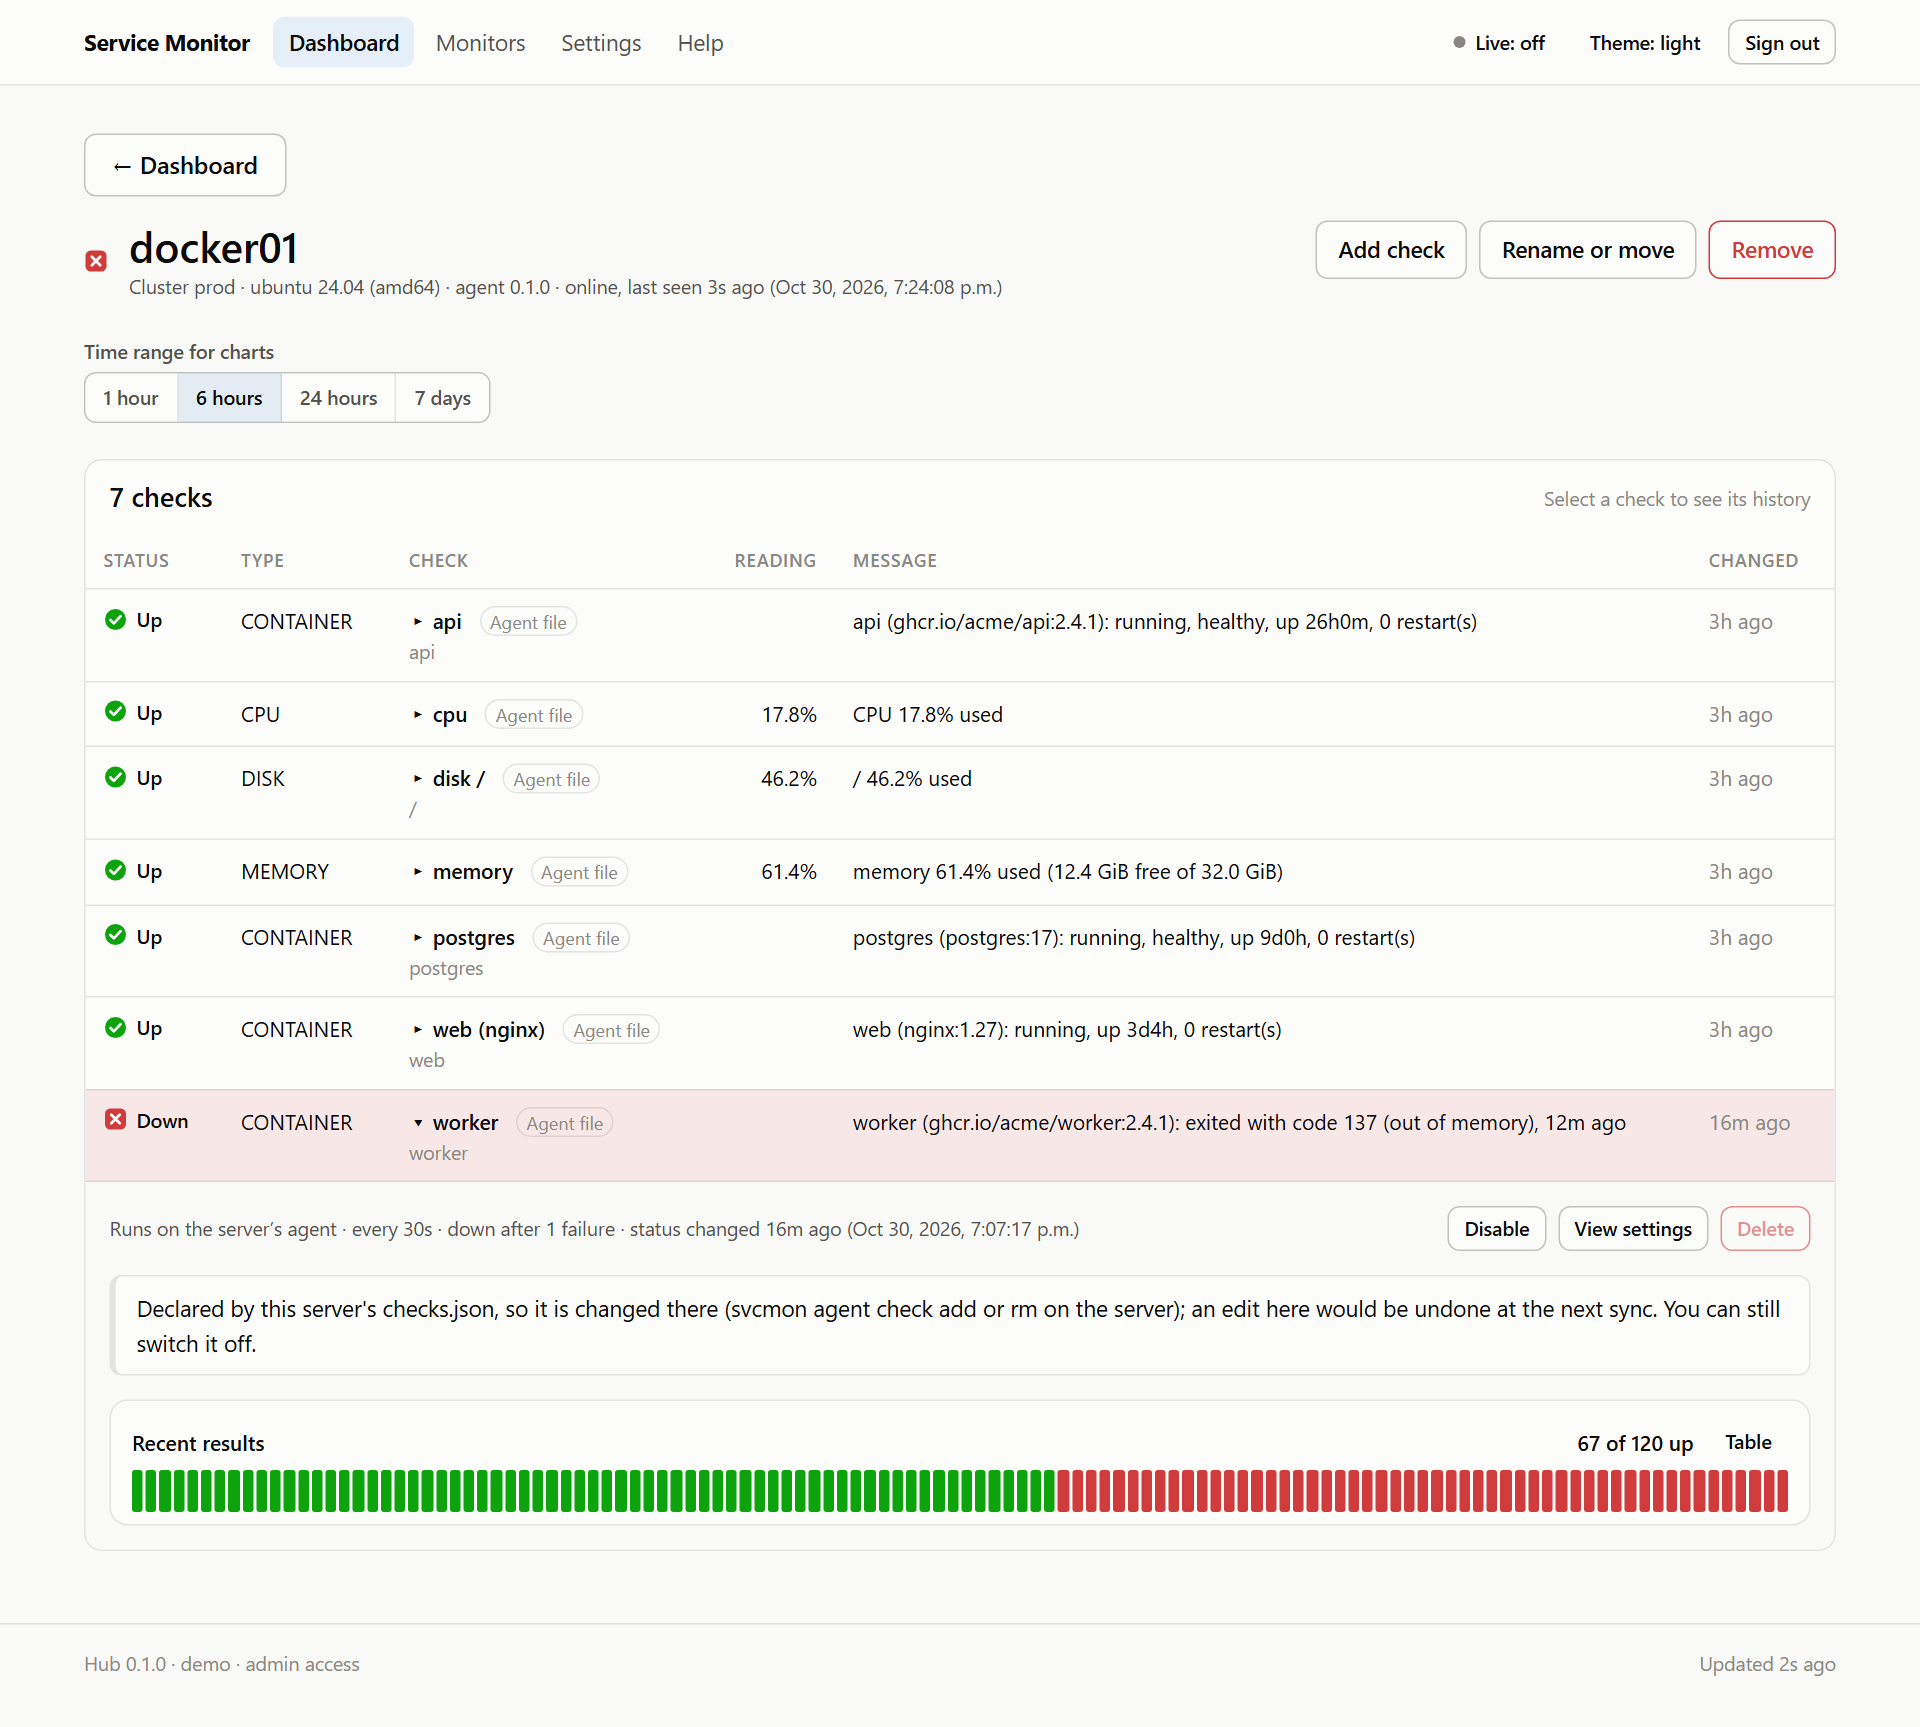
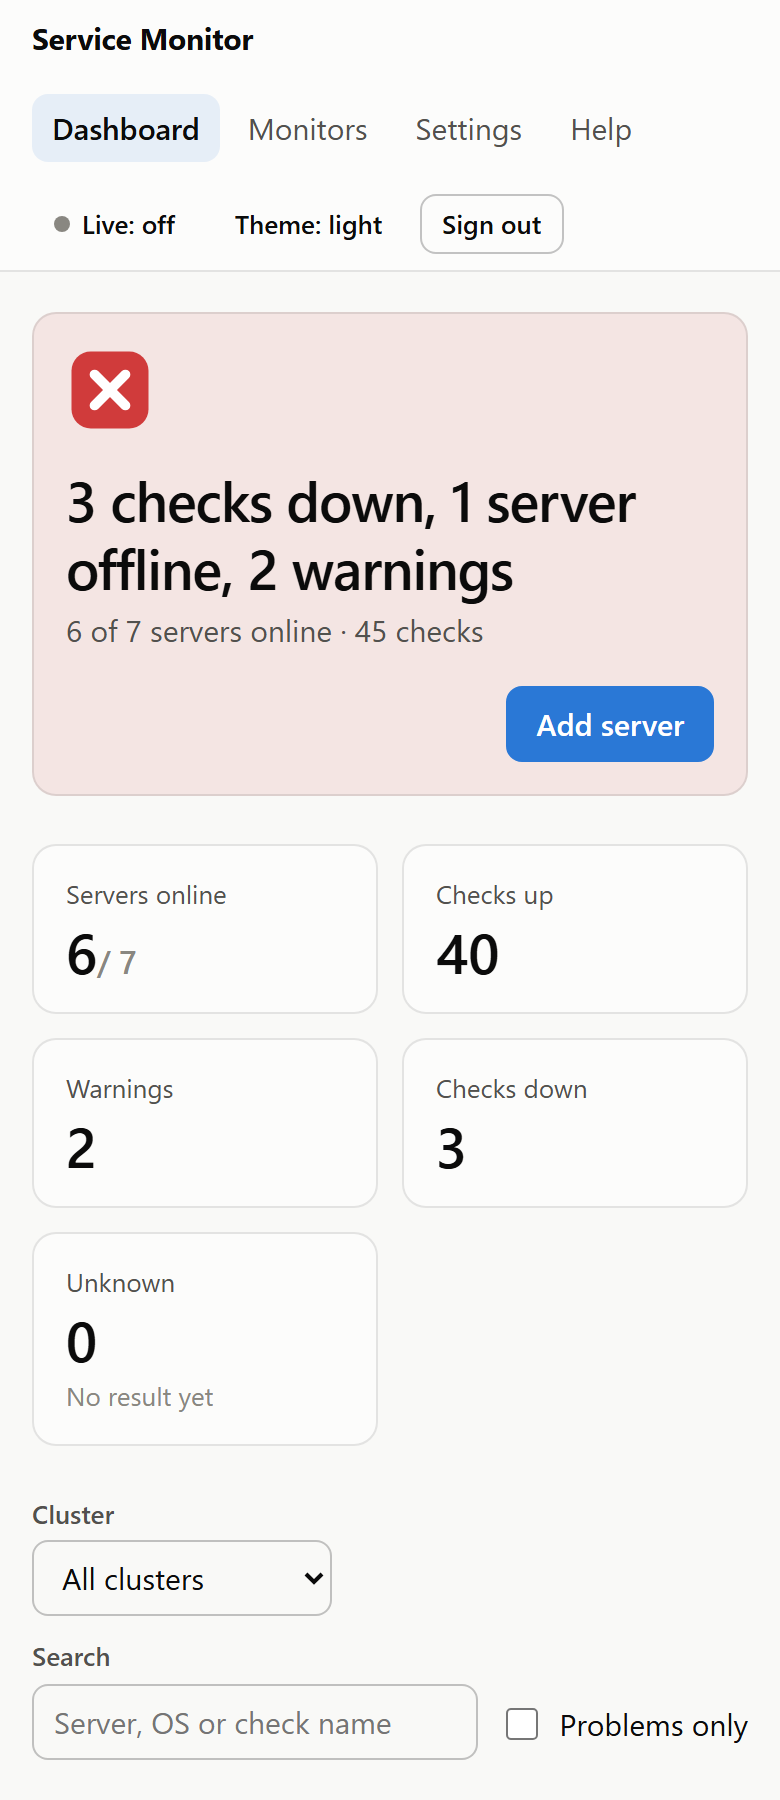
Try it
- Start the hub. Download
svcmon-hub-0.1.0.jarfrom the release page and runjava -jar svcmon-hub-0.1.0.jar. Openhttp://localhost:8080and sign in asadmin; it asks for a new password straight away. The Windows zip and the Linux tarball on the same page install it as a service. - Add a server. The dashboard's Add server page gives the one command to run on it, with the agent for its system from the same release.
- Say what to watch, in the dashboard or on the server, for example
svcmon agent check add service nginx.service.
Each release file comes with a checksum and a build provenance attestation, so you can check that it was built from the public source.
Read more
- README: the stack and the quick start
- Reference: running the hub, servers and checks, alerts, the API and every setting
- Design: why it is built this way
- Trust policy: licences, what data it keeps, what it connects to
- service-monitor-ui: the dashboard's own repository